
Noise-O-Meter
Noise-O-Meter
Making library noise visible through real-time feedback.
Overview
Making library noise visible.
Noise-O-Meter is an automated noise monitoring system developed for NYU Hack Dibner, a semester-long competition focused on improving the library experience.
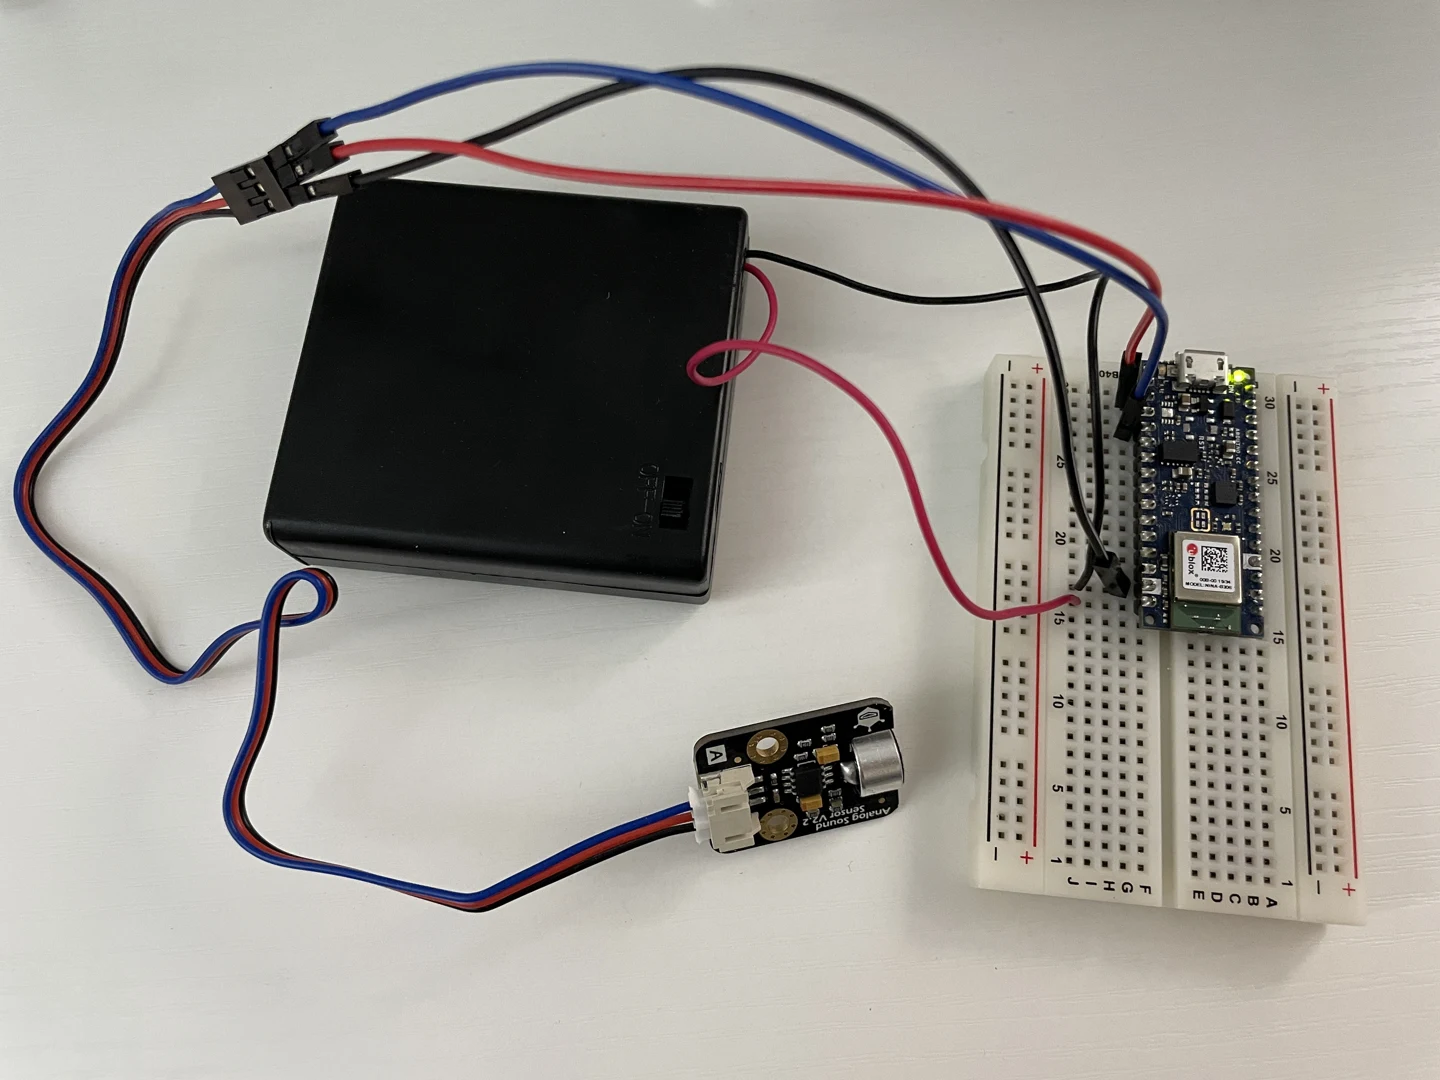
Using a sound sensor, Arduino, and p5.js, the prototype measures noise levels and displays a corresponding decibel value in real time. It acts as an automated mediator, helping students recognize when their conversations may be affecting others.
My Contribution
I worked across UX research, interaction design, and prototype development, connecting student needs with a working physical computing prototype.
Research to Prototype
My responsibilities included conducting research, surveys and user interviews, synthesizing findings, and prototyping with Arduino.
Research
Understanding what students need from the library.
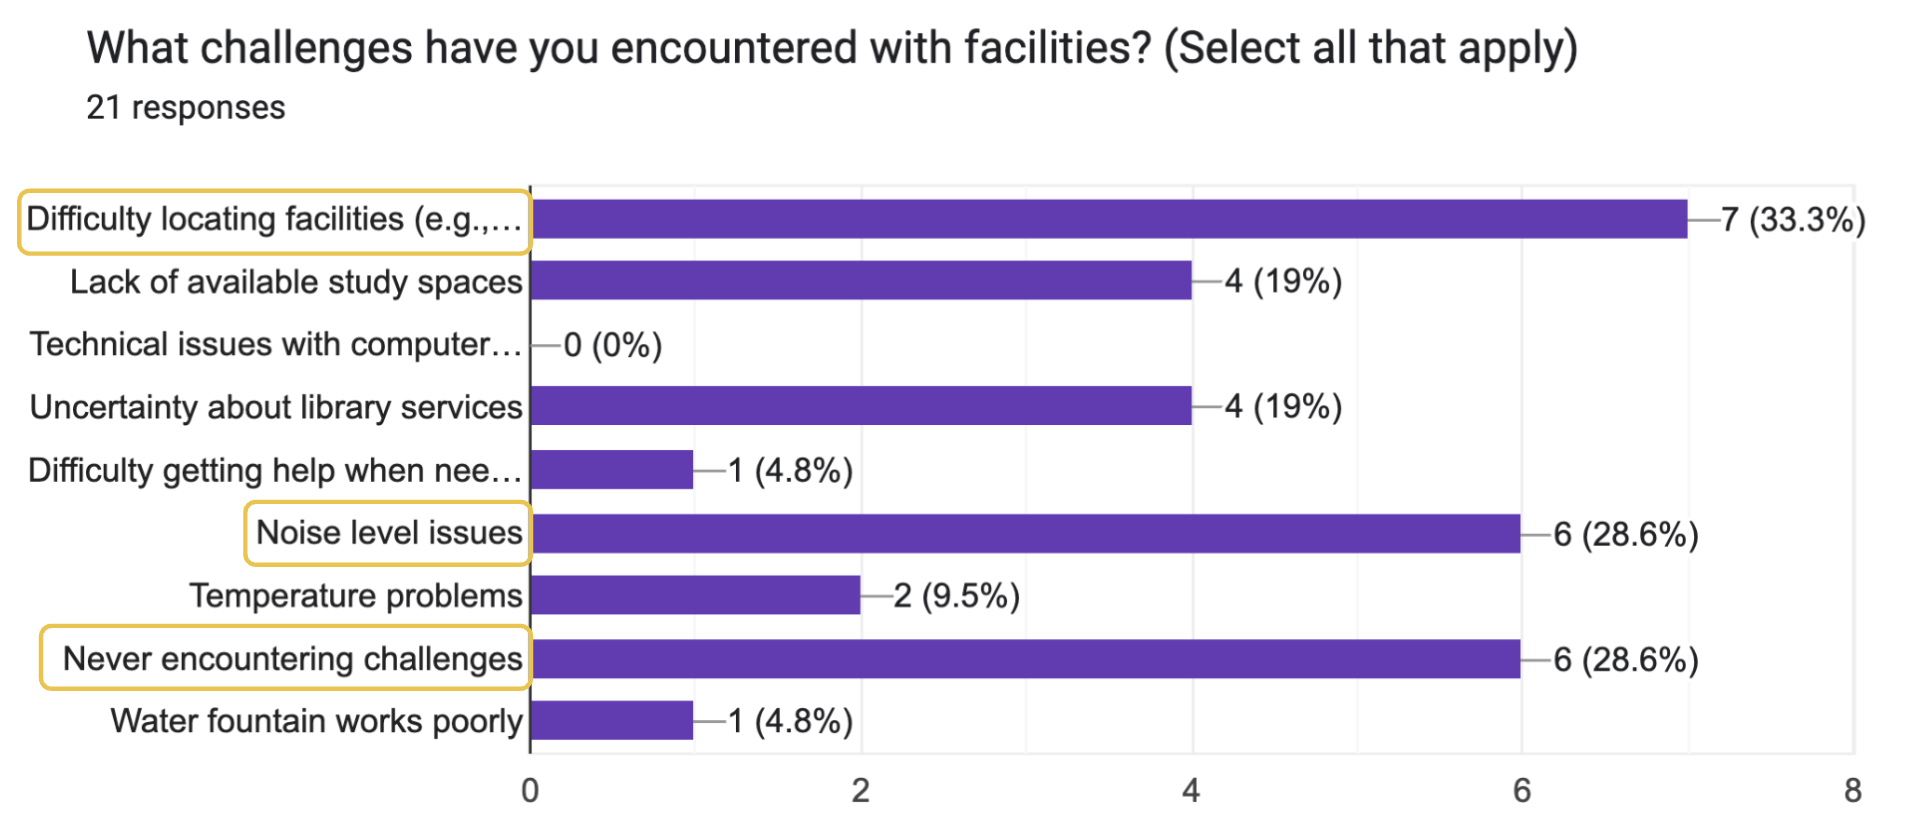
We surveyed 21 library students to identify the challenges they faced and the resources they used most. Two recurring concerns stood out: difficulty locating facilities and persistent noise.
Choosing a Focus
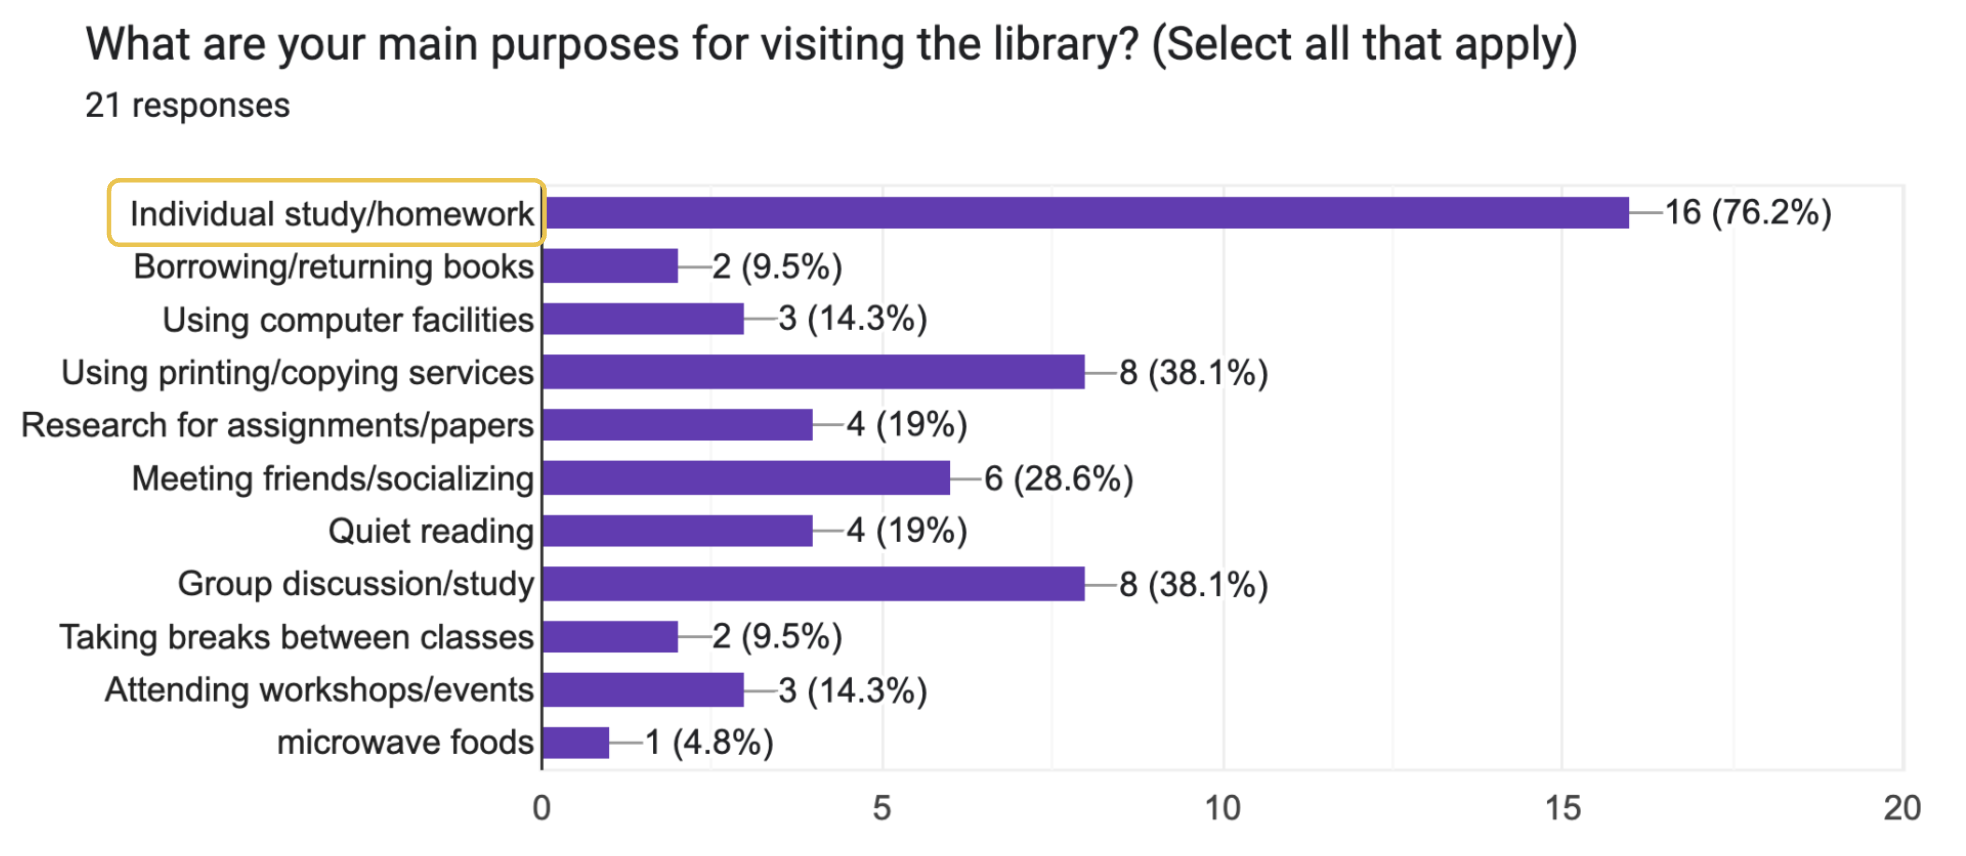
To choose a direction, we looked more closely at why students visited the library. Individual study was the most common purpose, and study rooms and spaces were the most frequently used resource.
76.2%
Individual Study
16 of 21 respondents visited the library for individual study or homework.
71.4%
Study Spaces
15 of 21 respondents regularly used study rooms or spaces.
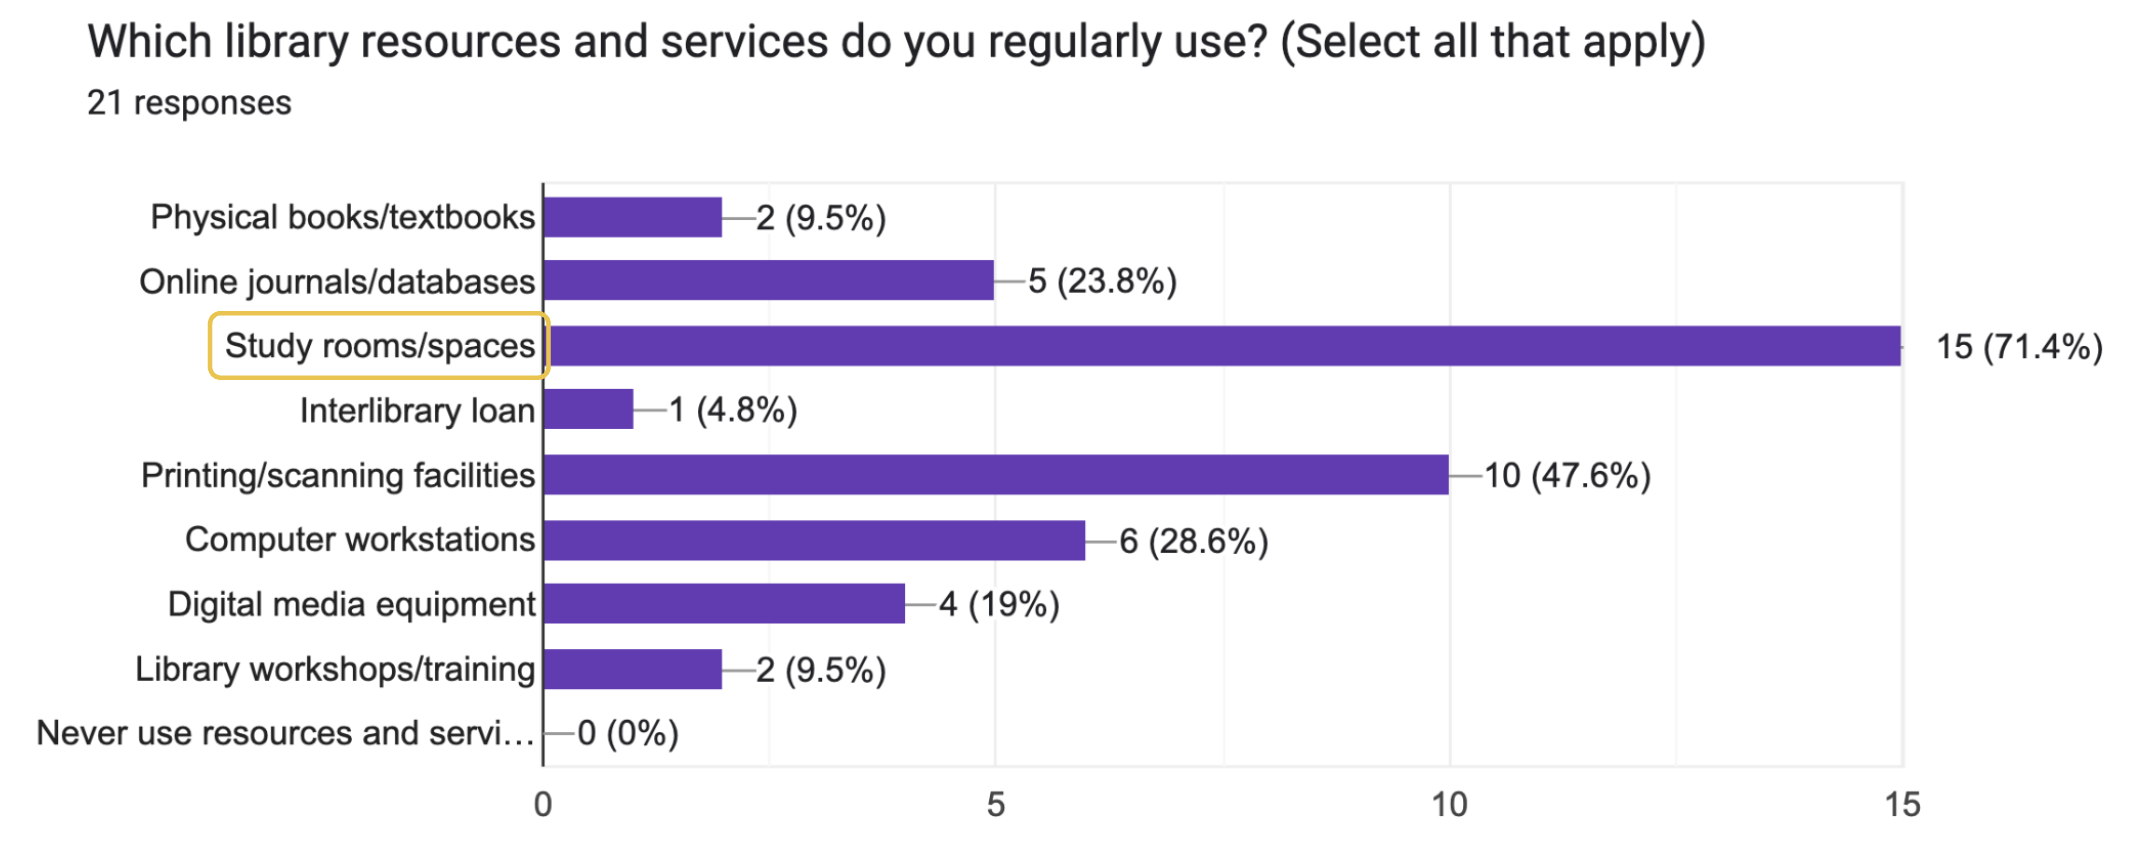
Because focused study was central to the library experience, we chose to address noise rather than facility finding. This gave us a clear direction: help students become more aware of their volume in shared study spaces.
Noise Testing
Listening to the spaces students study in.
We took noise readings in different areas of the Dibner Library to understand how the sound environment varied between floors and spaces. These observations helped us design feedback for the collaborative third floor and the quieter fourth-floor study area.
Third Floor
The left and right sides were observed at the level of normal conversation.
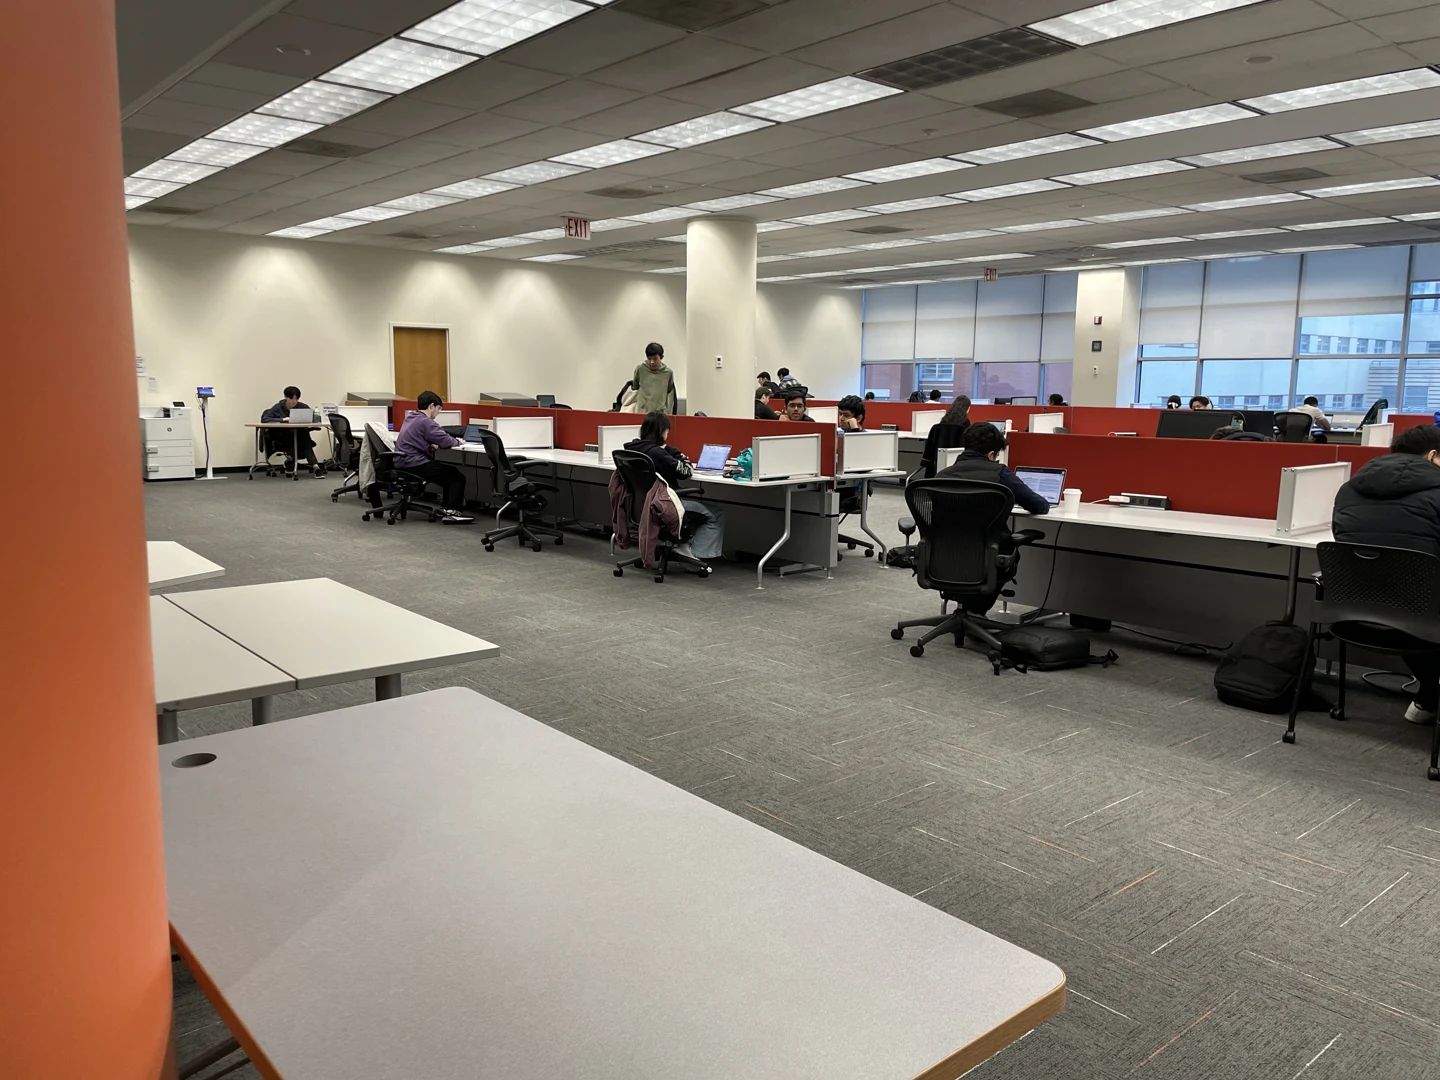
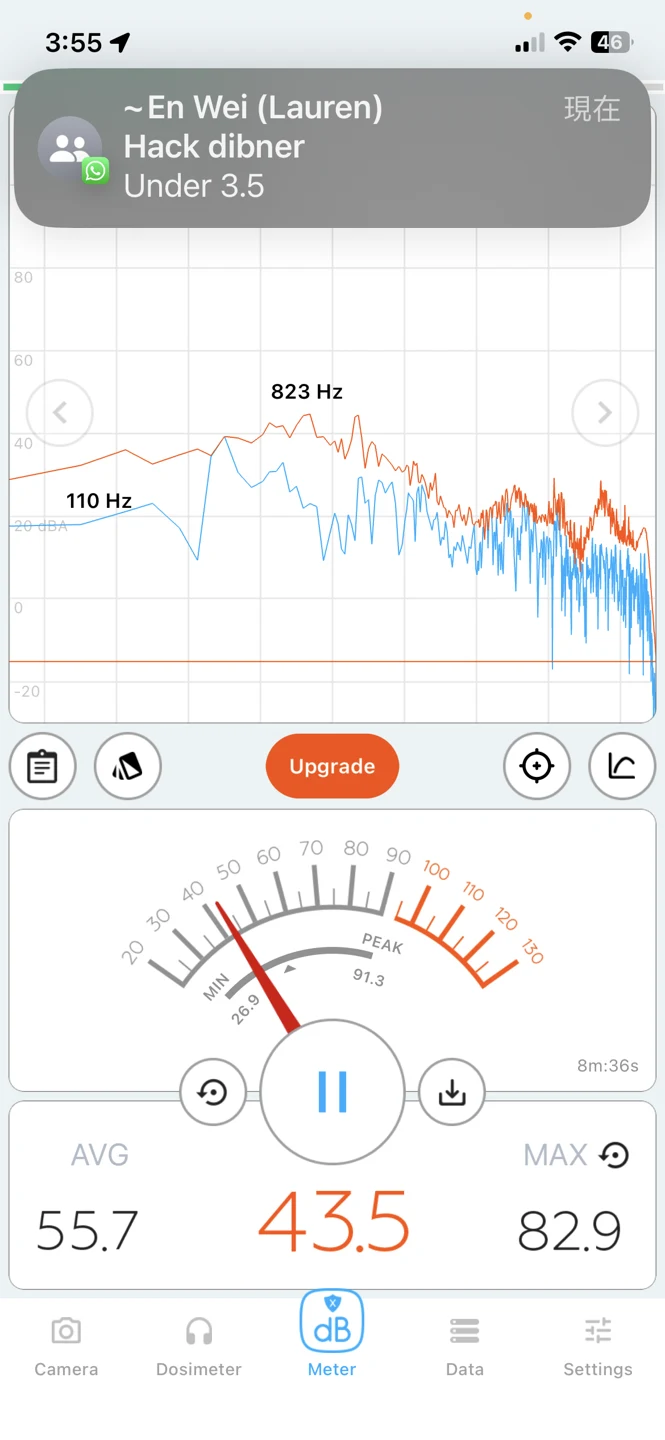
43.5 dB · Left side
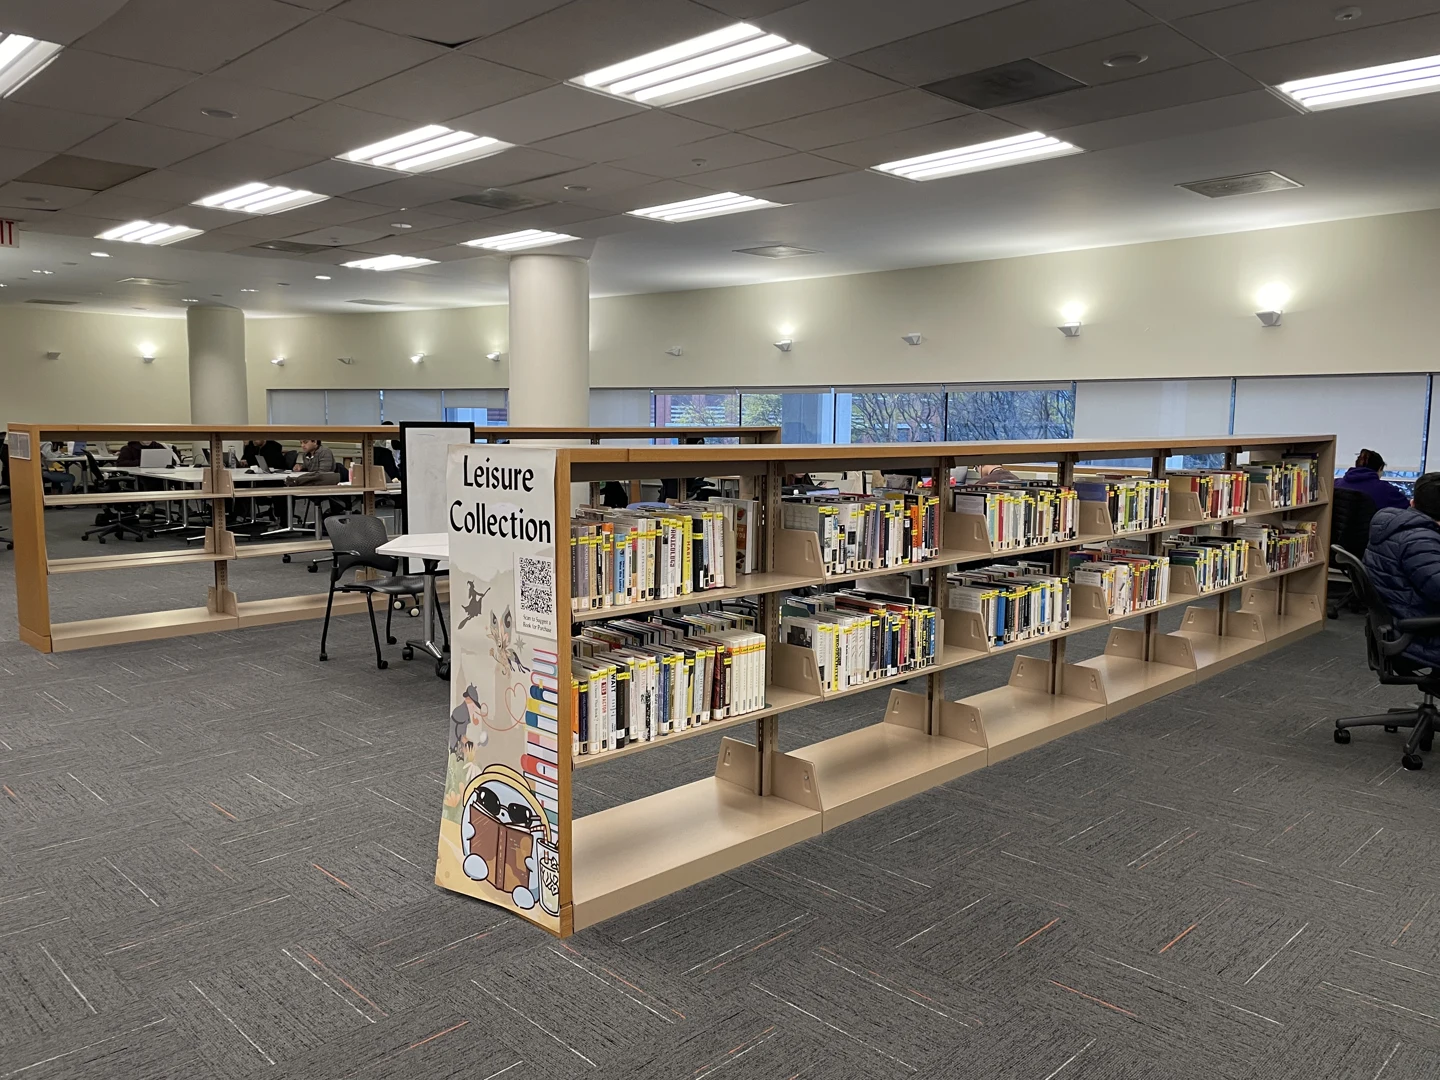
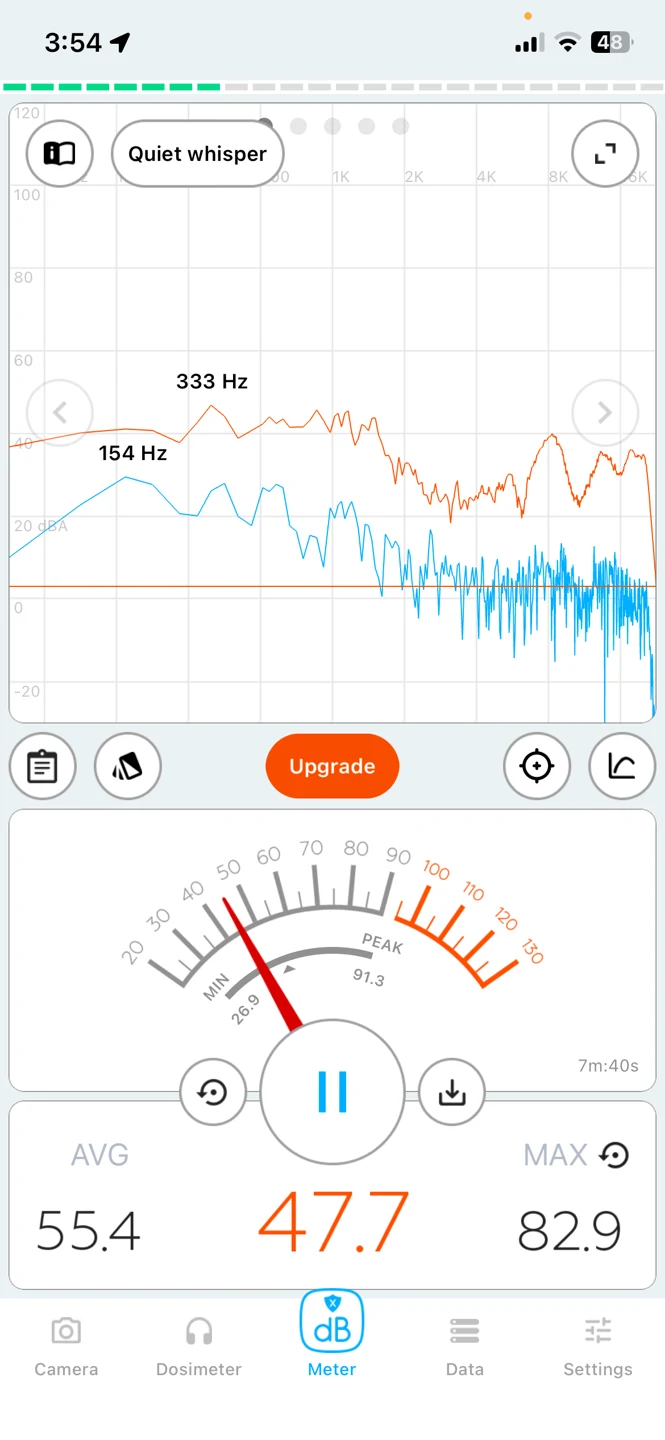
47.7 dB · Right side
Fourth Floor
Readings differed between an area where many people were talking and an area observed under quiet conditions.
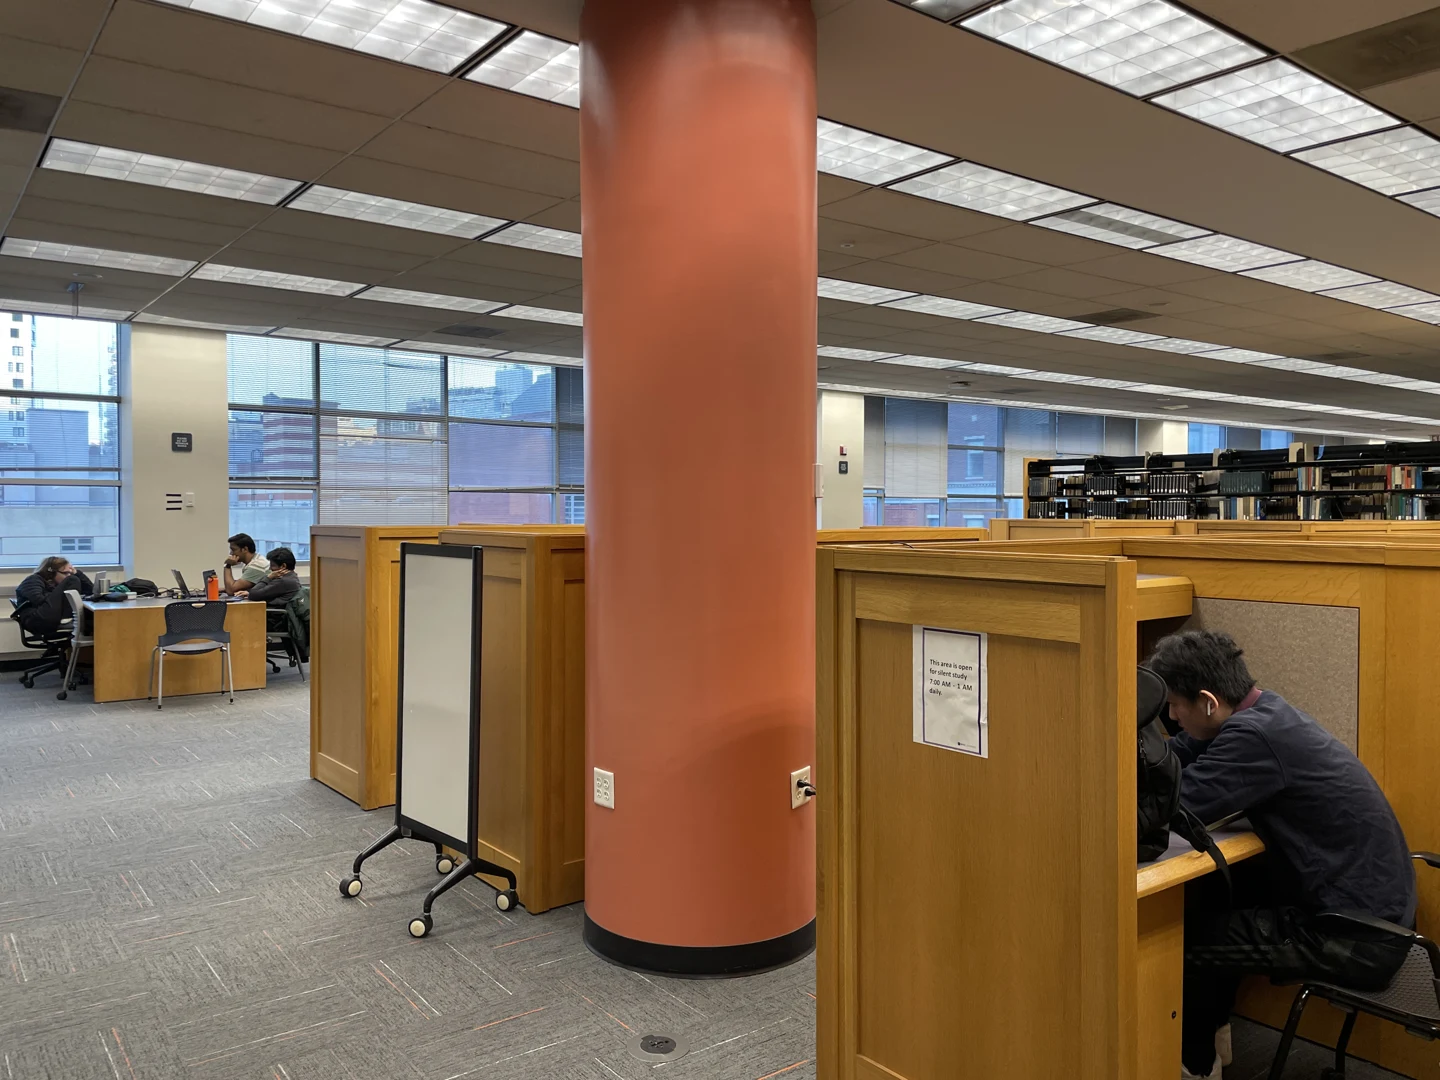
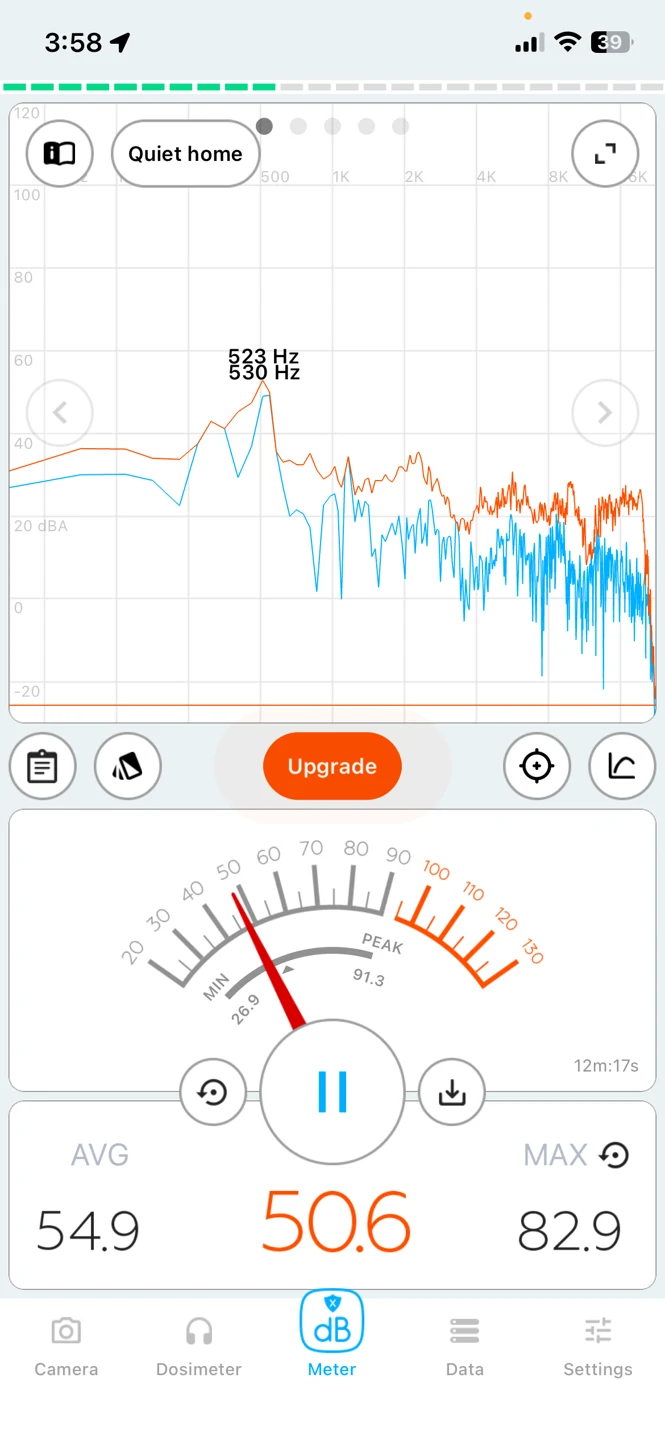
50.6 dB · Many people talking
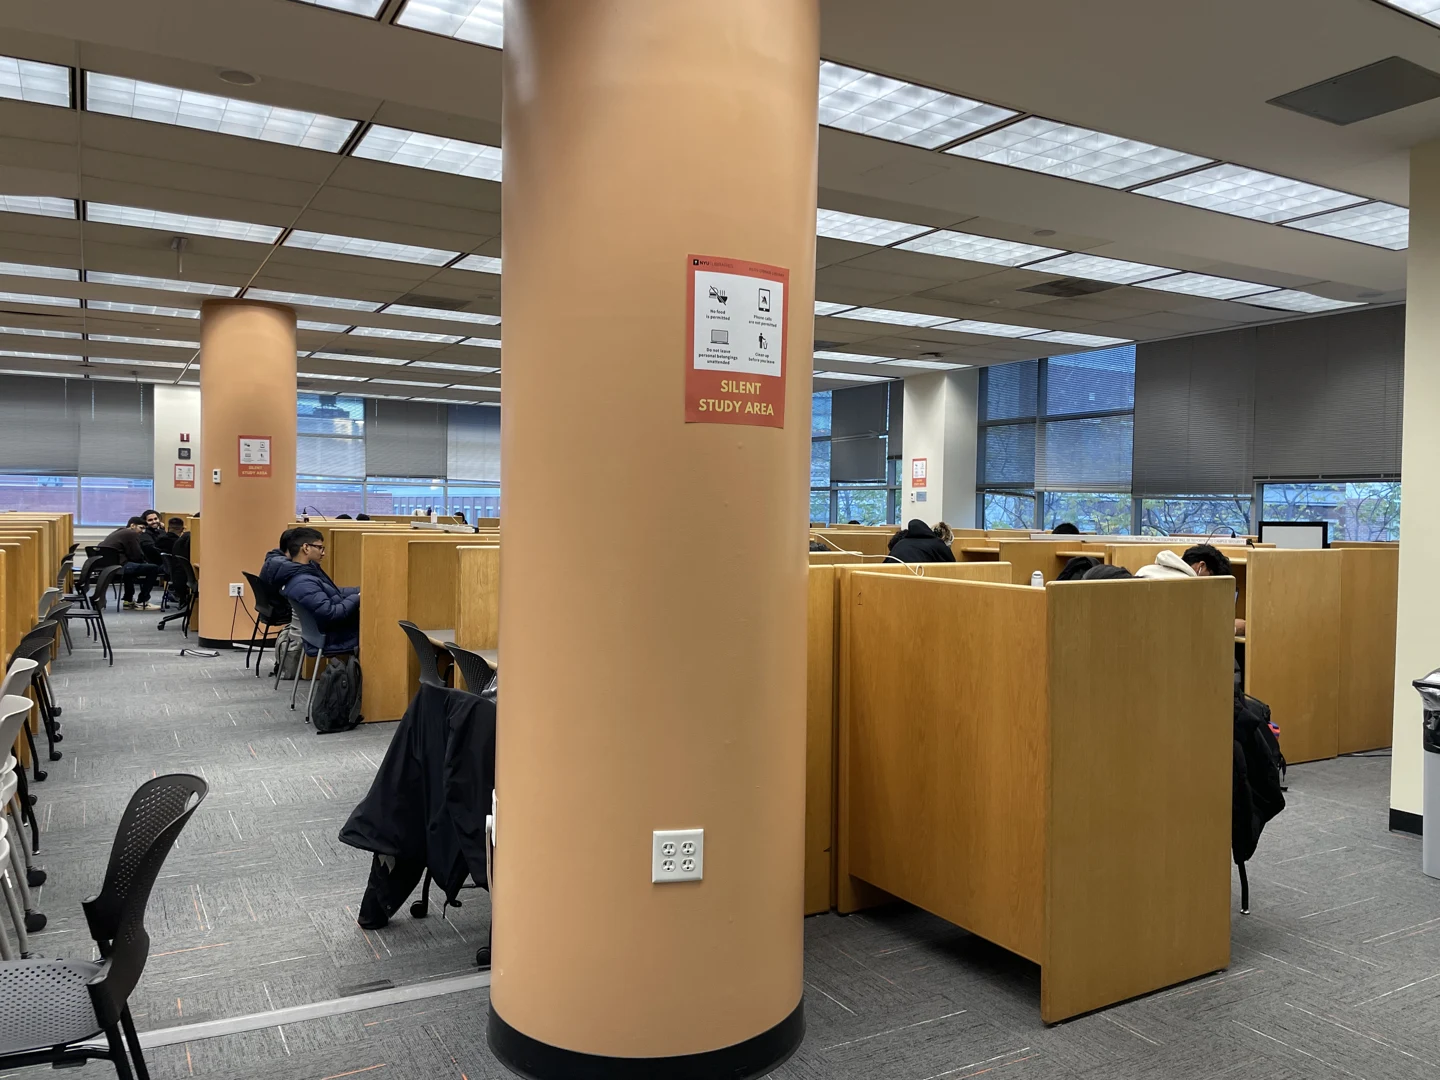
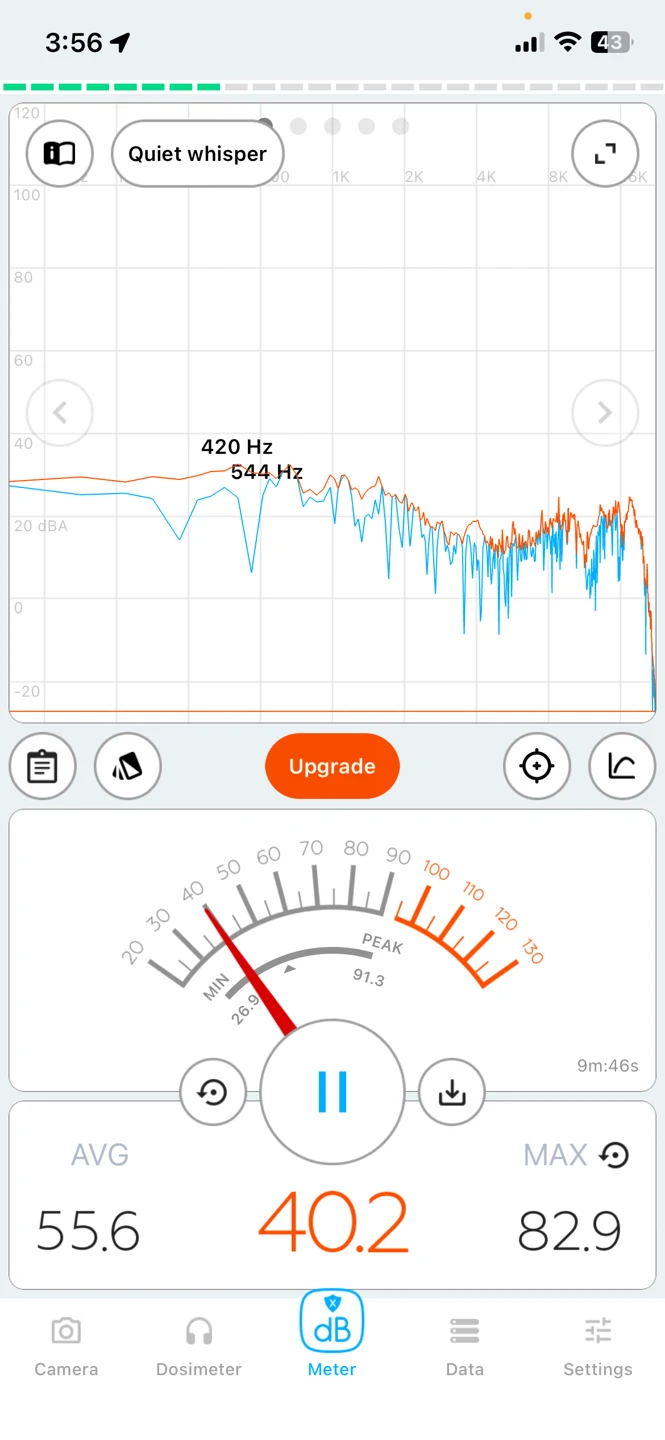
40.2 dB · Quiet conditions
Design
A gentle prompt to be considerate.
The system combines physical sensing with a simple visual interface. Instead of requiring a student or staff member to intervene, it makes the current noise level visible and provides a prompt when the volume rises.
System Components
- Arduino Nano 33 BLE microcontroller
- Gravity Analog Sound Sensor (DFROBOT DFR0034)
- p5.js visualization interface
Core Interactions
- Real-time noise monitoring
- Automated noise detection
- Visual warnings and considerate reminders
Setting Noise Ranges
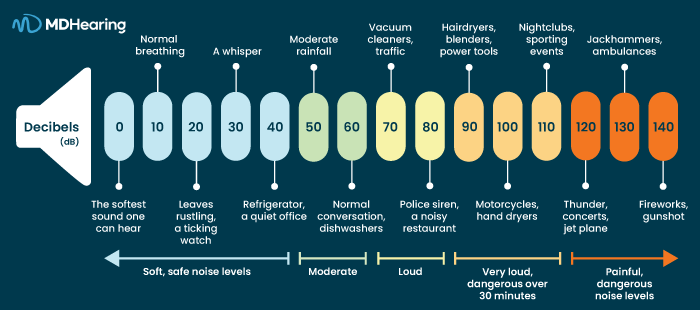
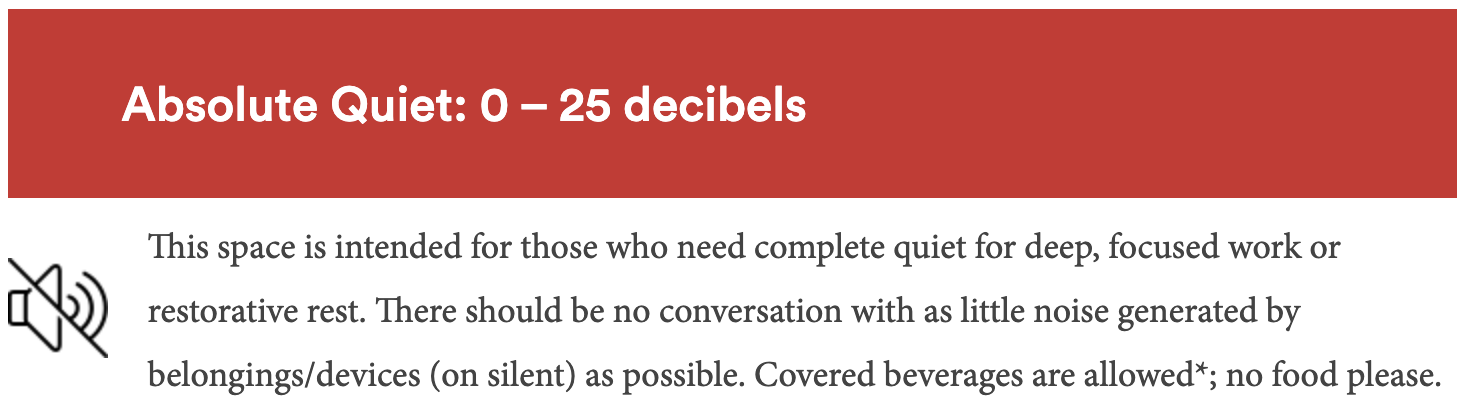
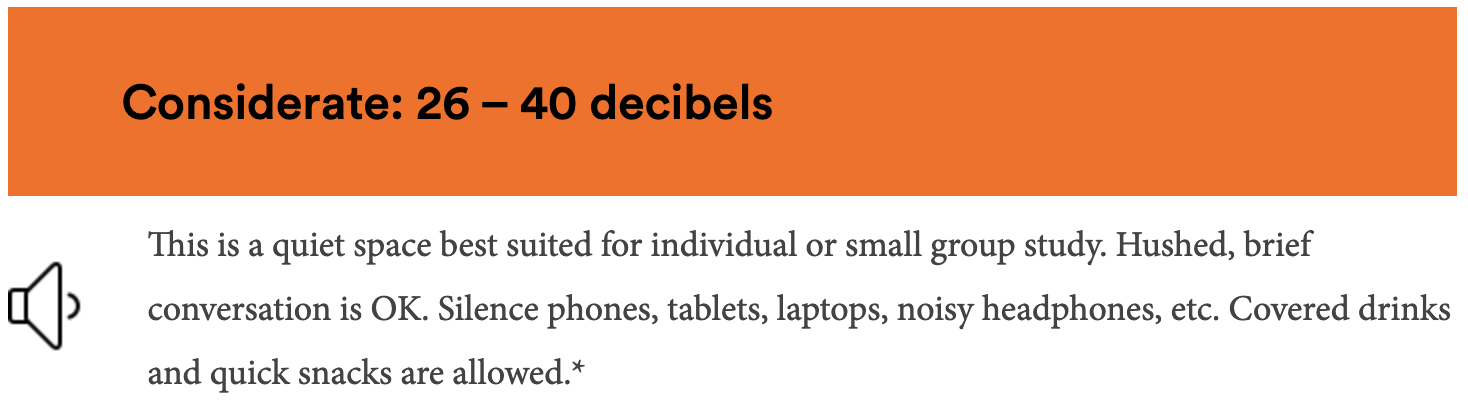
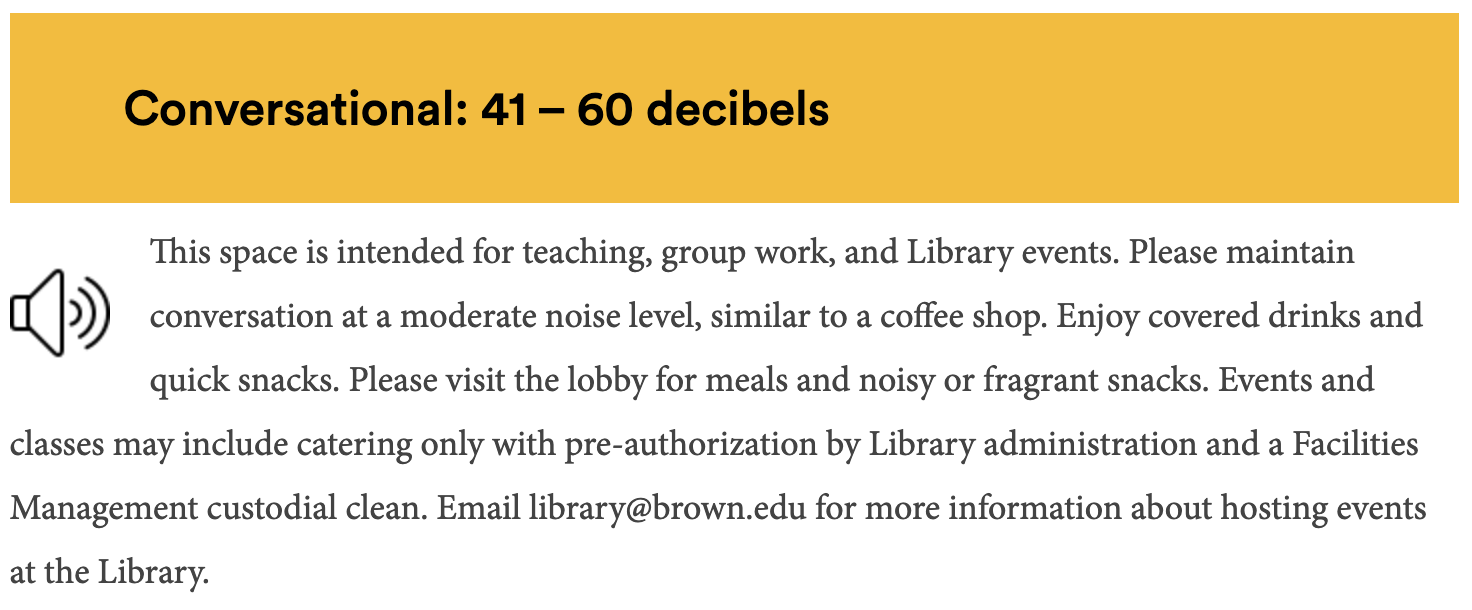
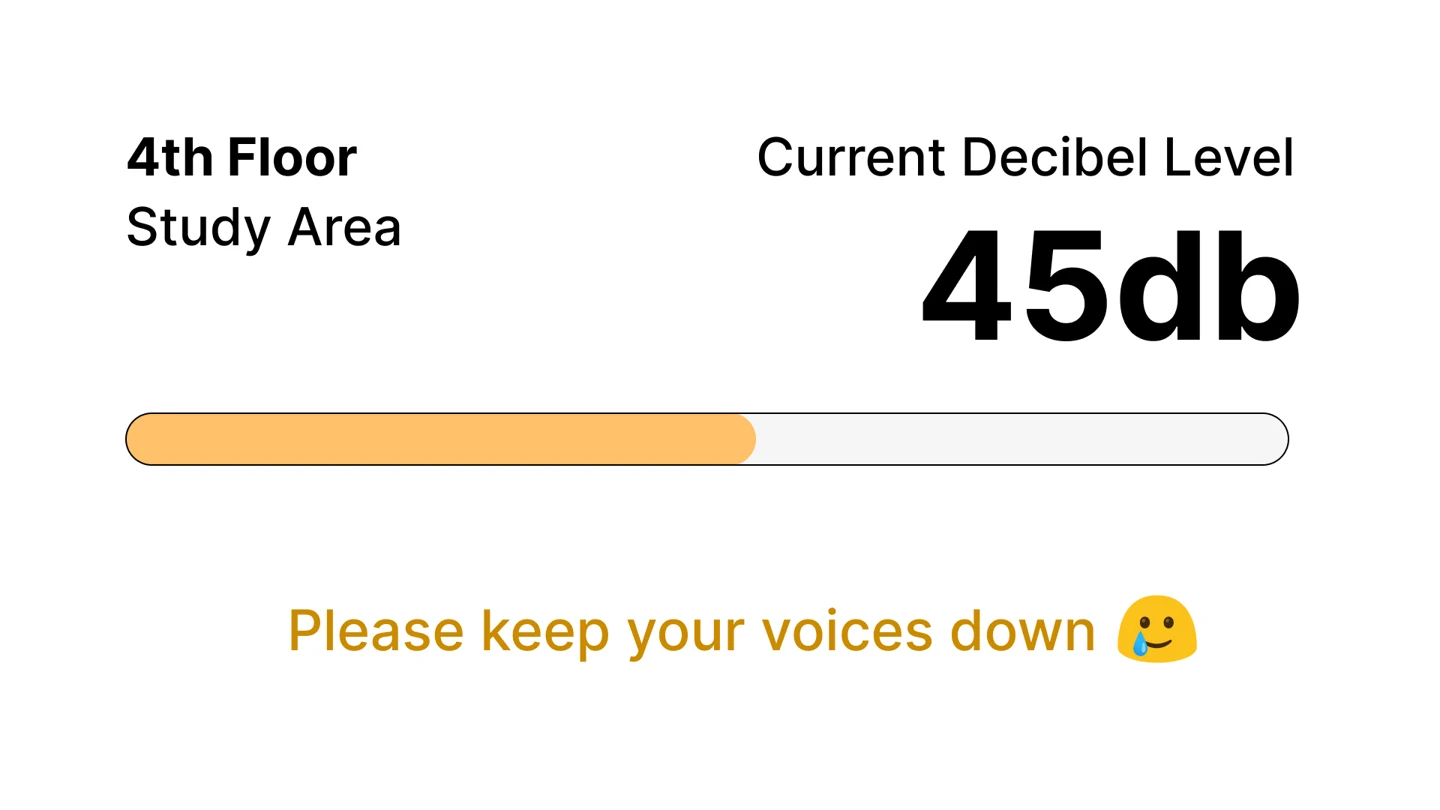
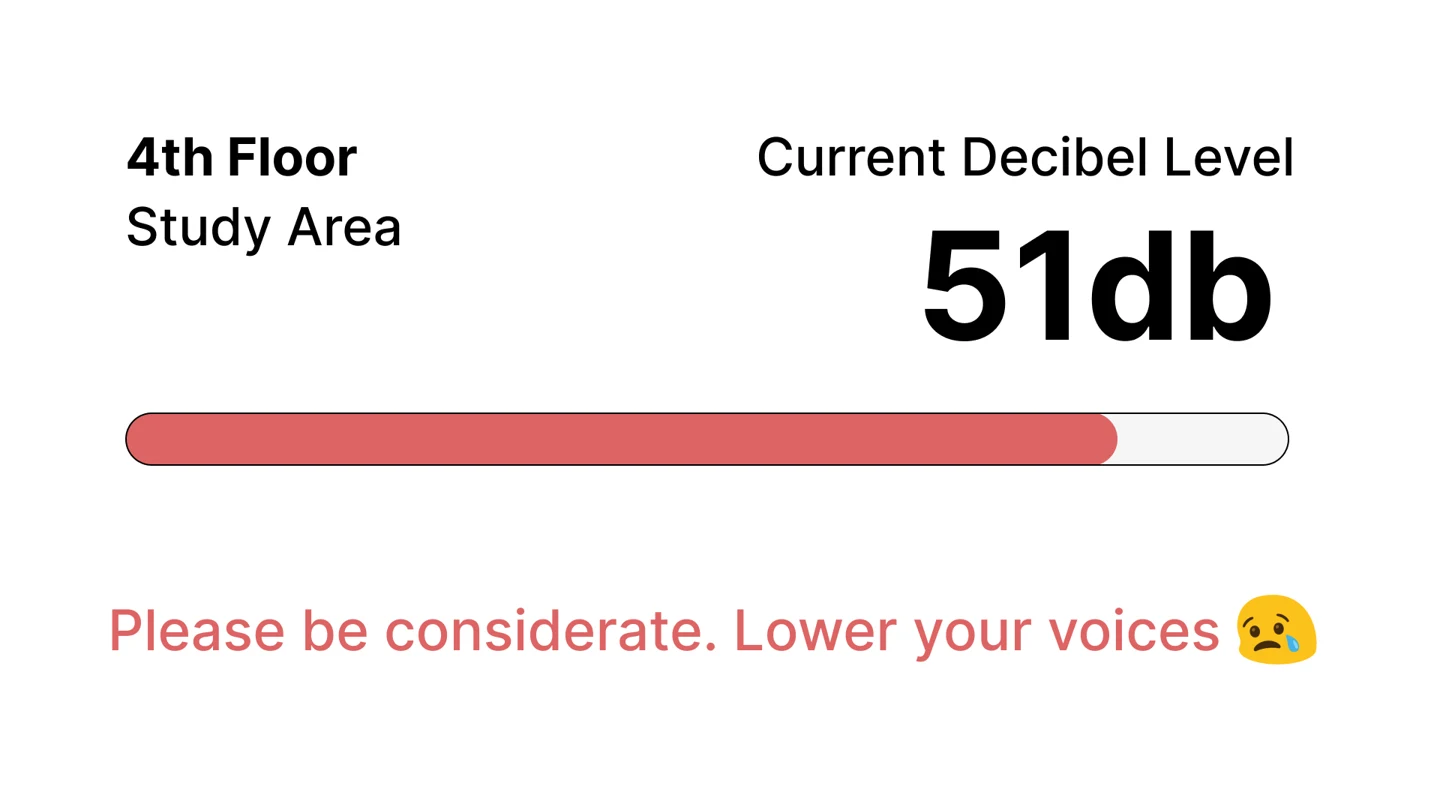
We reviewed everyday sound-level references and library guidance to establish quiet, moderate, and loud states. We then defined different thresholds for the third-floor collaborative area and the fourth-floor study area.
| Feedback State | Third Floor | Fourth Floor |
|---|---|---|
| Normal | 0–55 dB | 0–45 dB |
| Warning | 55–60 dB | 45–50 dB |
| Critical | >60 dB | >50 dB |
View sound-level references
Final Design
Real-time feedback, at a glance.
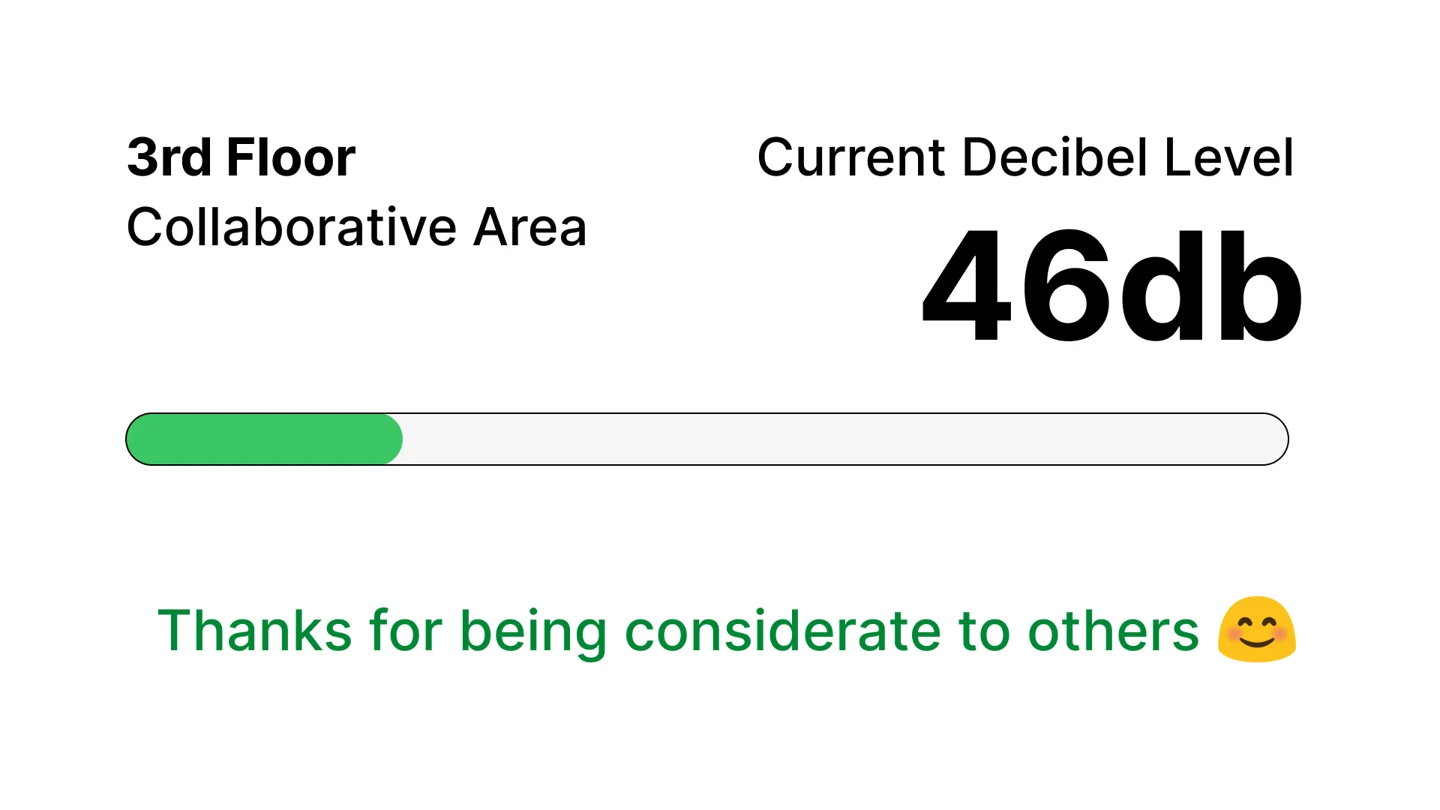
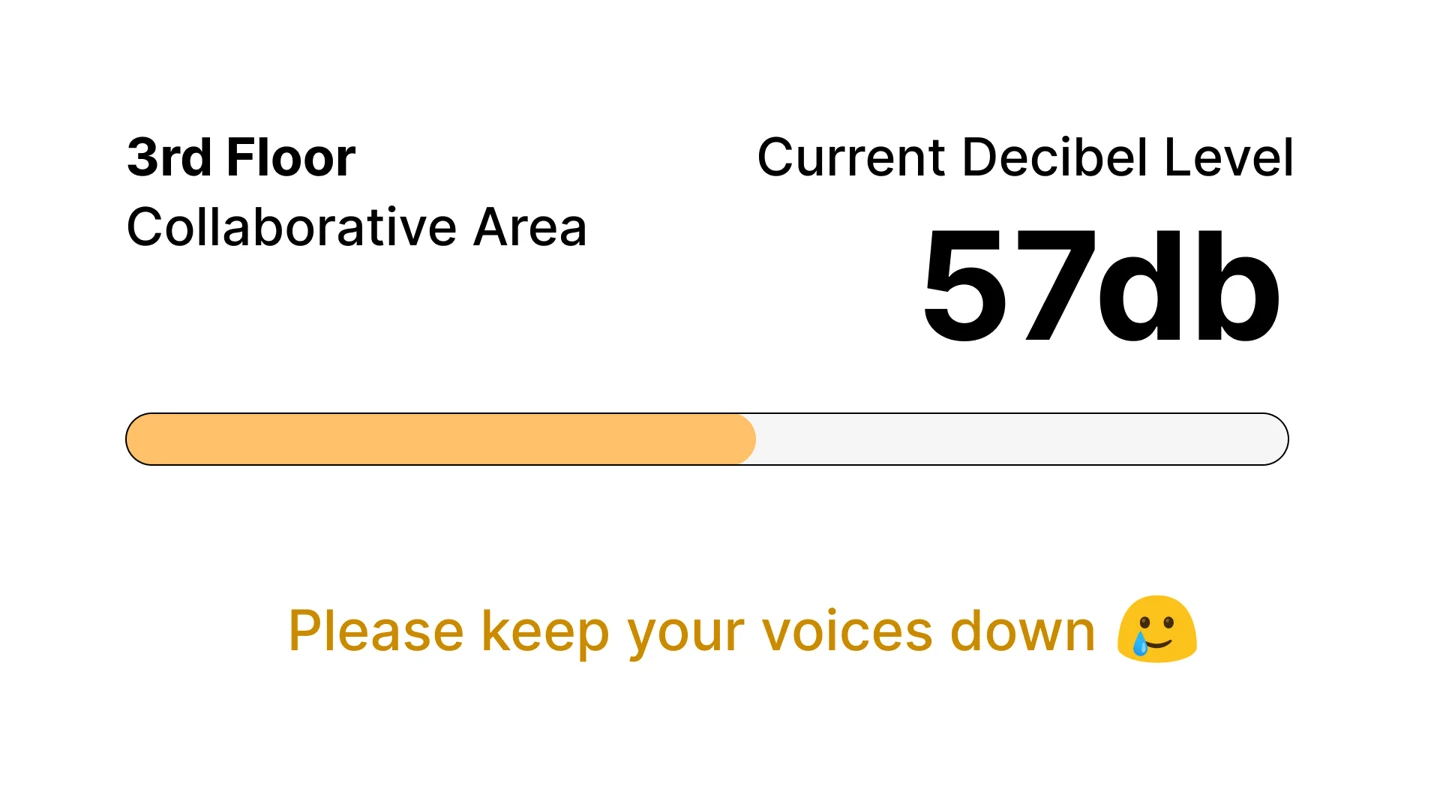
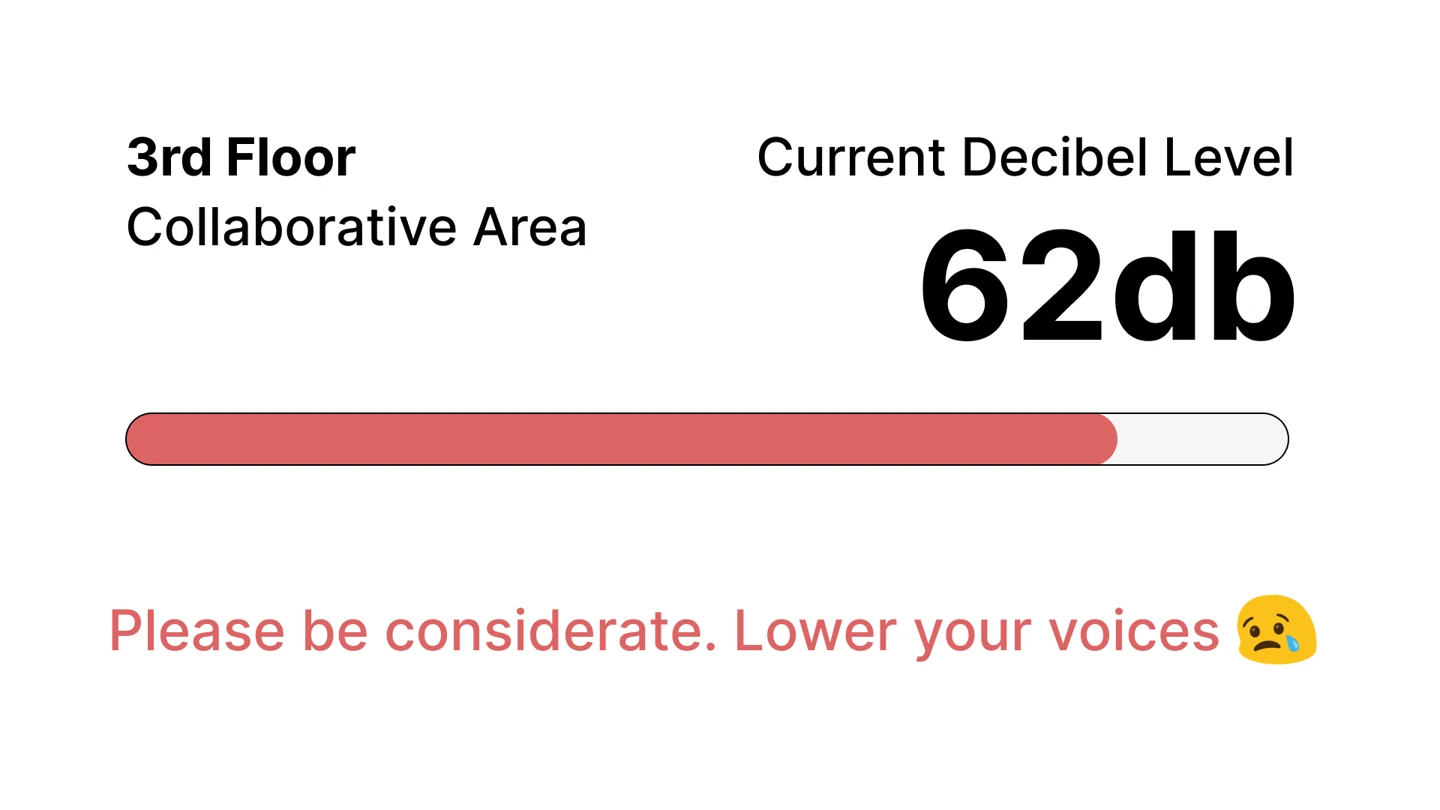
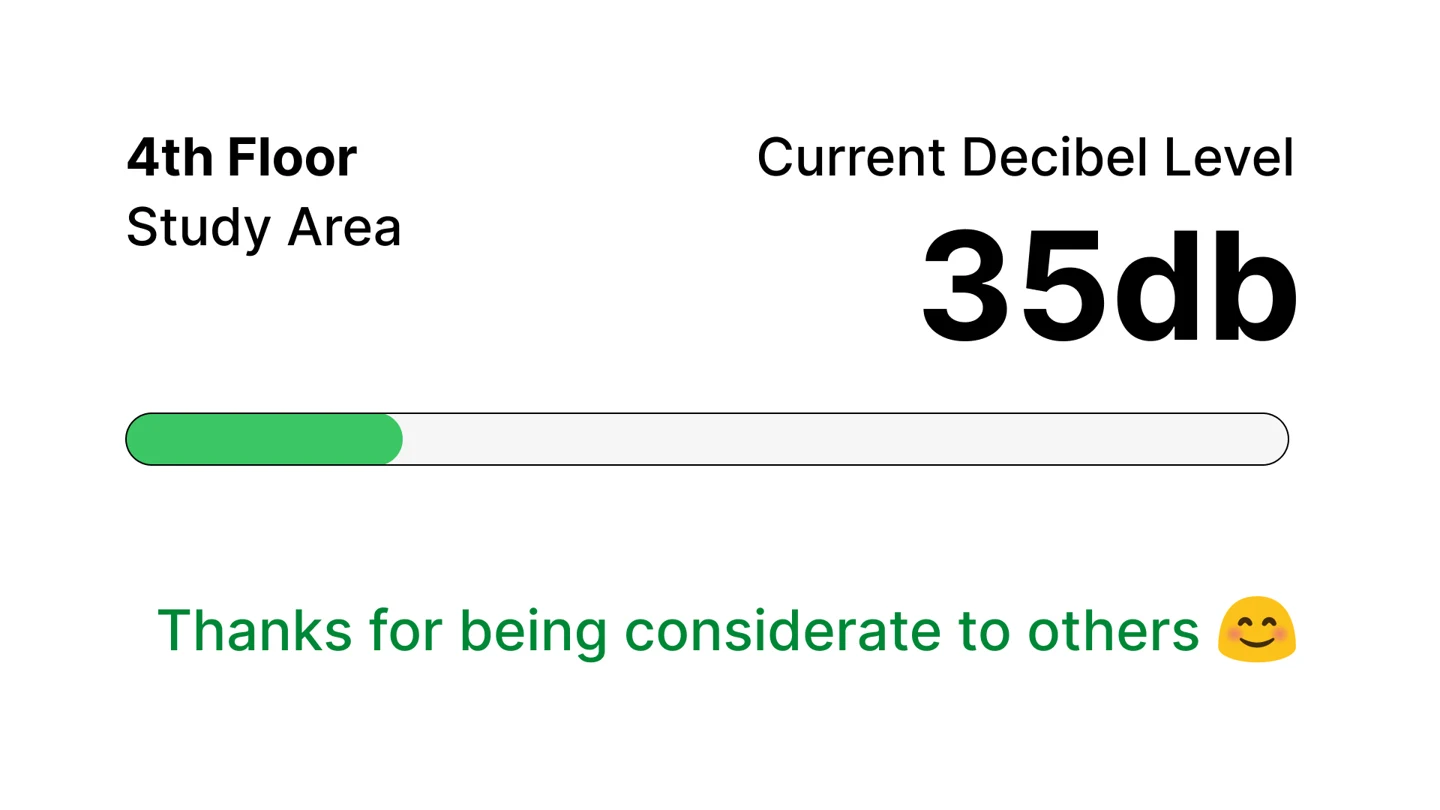
The monitor shows the floor, study area, current decibel reading, and a color-coded volume bar. Its message changes with the noise level, from a thank-you for being considerate to a reminder to lower voices.
Third Floor · Collaborative Area
Fourth Floor · Study Area
Live Demo & Prototype
The working prototype connects the sound sensor to an Arduino and visualizes the readings in p5.js. The demo shows the display updating as sound is detected.
Hardware
Arduino Nano 33 BLE and Gravity Analog Sound Sensor.
Software
Arduino IDE and p5.js.
Placement
Designed for different library spaces.
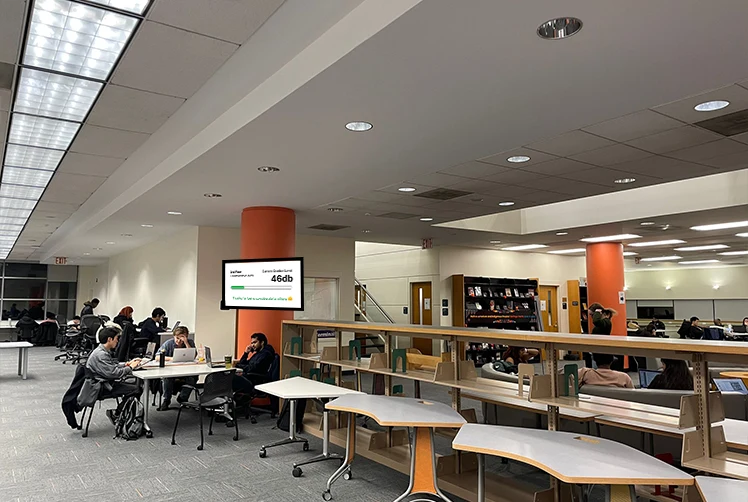
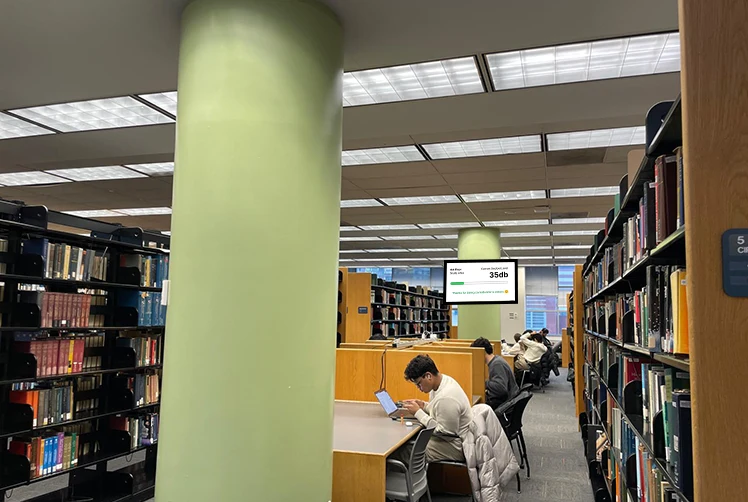
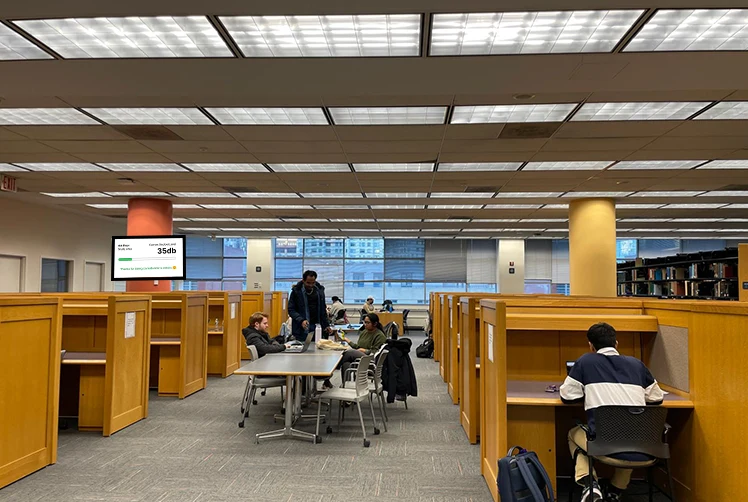
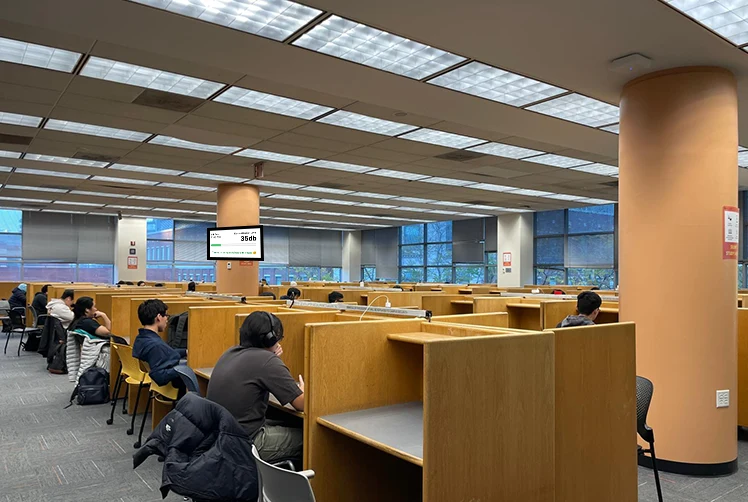
We proposed placing the displays where students could see them while using the library. The number of screens and sound sensors would reflect each floor’s layout.
Third Floor
The more open space would use two screens and two sound sensors.
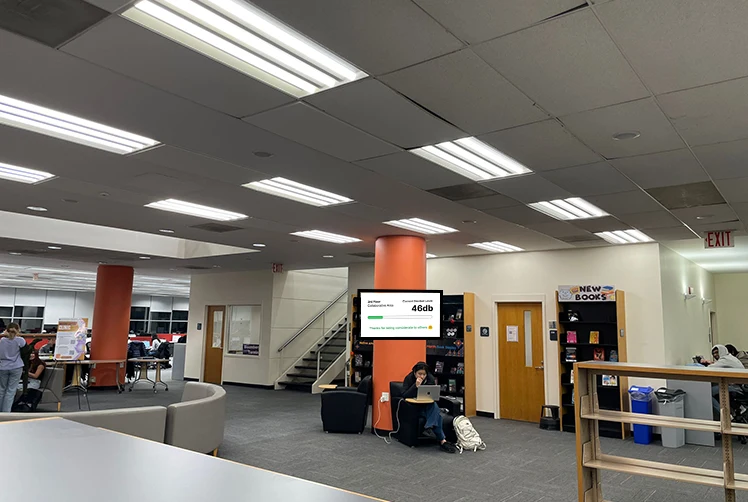
Fourth Floor
With more bookshelves dividing the space, we proposed three screens and three sound sensors.
Impact
First place at NYU Hack Dibner.
Noise-O-Meter won first place at NYU Hack Dibner 2024. We presented our research and working prototype at the final presentation, showing how a simple sensing system could help address a shared library concern.

Takeaway
Connecting research with physical interaction.
Make the Invisible Visible
Noise is easy to overlook when people are focused on their own conversations. This project explored how real-time visual feedback can make a shared environmental condition easier to recognize.
Design for the Context
The different noise conditions and layouts on the third and fourth floors shaped both the feedback thresholds and the proposed placement. Connecting survey findings, on-site observations, and a working prototype helped turn a broad library problem into a focused design response.